Top 5 Custom GA4 Reports with Set Up Instructions
Google Analytics 4 (GA4) is a pivotal tool for all website and marketing managers. This guide delves into the top 5 custom GA4 reports, indispensable for businesses seeking to harness the depth of their digital data. From user engagement to e-commerce performance, these reports provide tailored insights, enabling informed decision-making in an ever-competitive digital landscape.
Report 1: User Engagement Report
Understanding the User Engagement Report
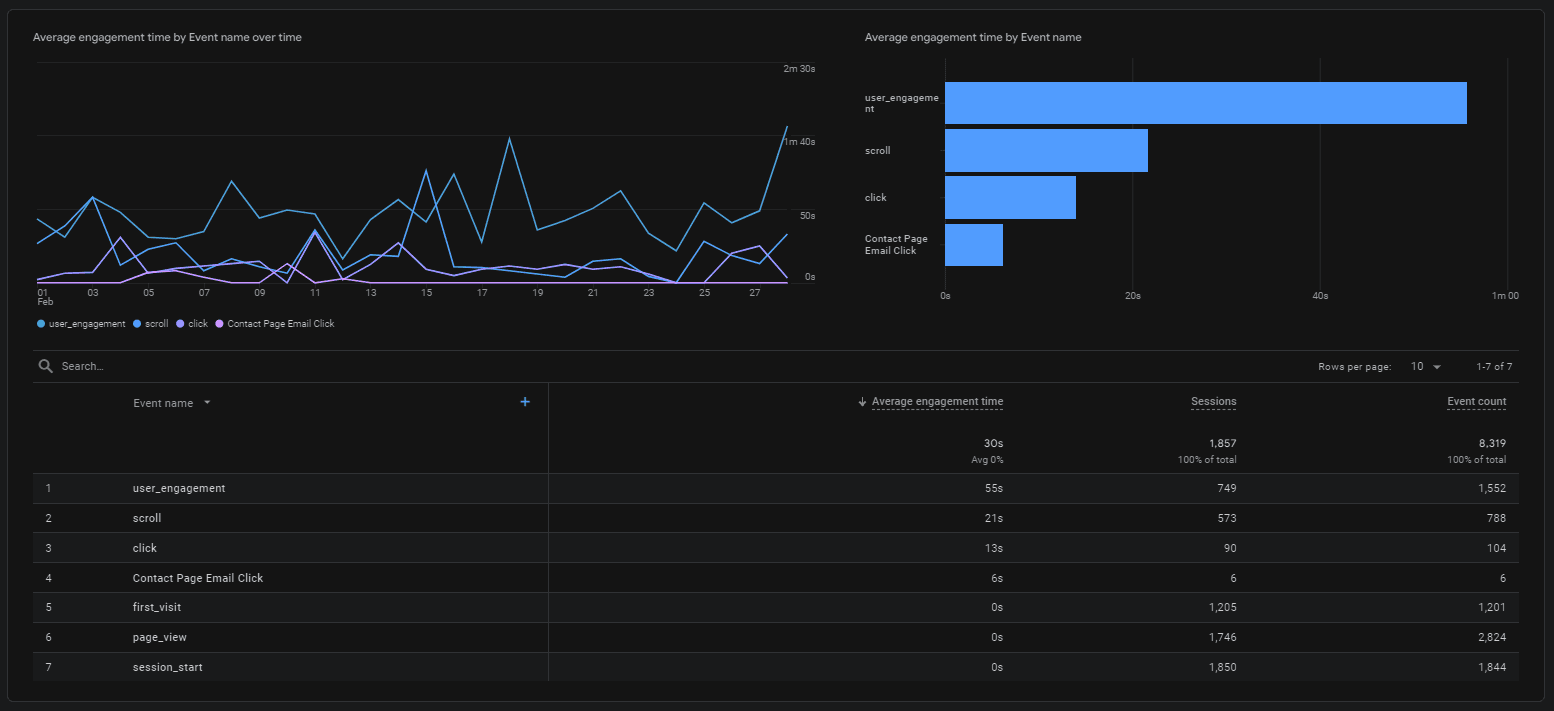
The User Engagement Report in GA4 helps you understand how users interact with your website or app. It goes beyond traditional metrics, offering a nuanced view of user behaviour. This report primarily focuses on engagement time, pages or screens per session, and event count, providing a comprehensive view of user activity.
Creating the User Engagement Report in GA4
- Access Your GA4 Property: Log in to your Google Analytics account and select the GA4 property you wish to analyse.
- Navigate to Reports: In the GA4 interface, click 'Reports' on the left-hand menu.
- Custom Reports: Select 'Library' at the bottom of the menu to access the report builder.
- Create New Report: Choose 'Create New Report' and select 'Create Detailed Report'.
- Setting Up the Report:
- Create a blank report.
- Under 'Dimensions', select dimensions like 'Event Name', 'Page Title' or 'App Screen', depending on whether you're tracking a website or an app.
- For 'Metrics', include 'Engagement Time', 'Sessions', and 'Event Count'. These metrics provide a holistic view of how users interact with your content.
- Click save and title the report ‘User Engagement’.
- Customisation: Customise the report further by adding filters based on your specific requirements, such as user demographics or traffic sources.
- Save and Analyse: Save the report for easy access in the future. Regularly analyse this report to understand user engagement trends and make data-driven decisions to improve user experience.
Interpreting the Report
The User Engagement Report provides valuable insights into how long users stay engaged, what they interact with, and the frequency of their interactions. By analysing this data, businesses can identify what captures user attention and areas for improvement and tailor their content strategy to enhance user engagement.
Report 2: Conversion Analysis Report
Understanding the Conversion Analysis Report
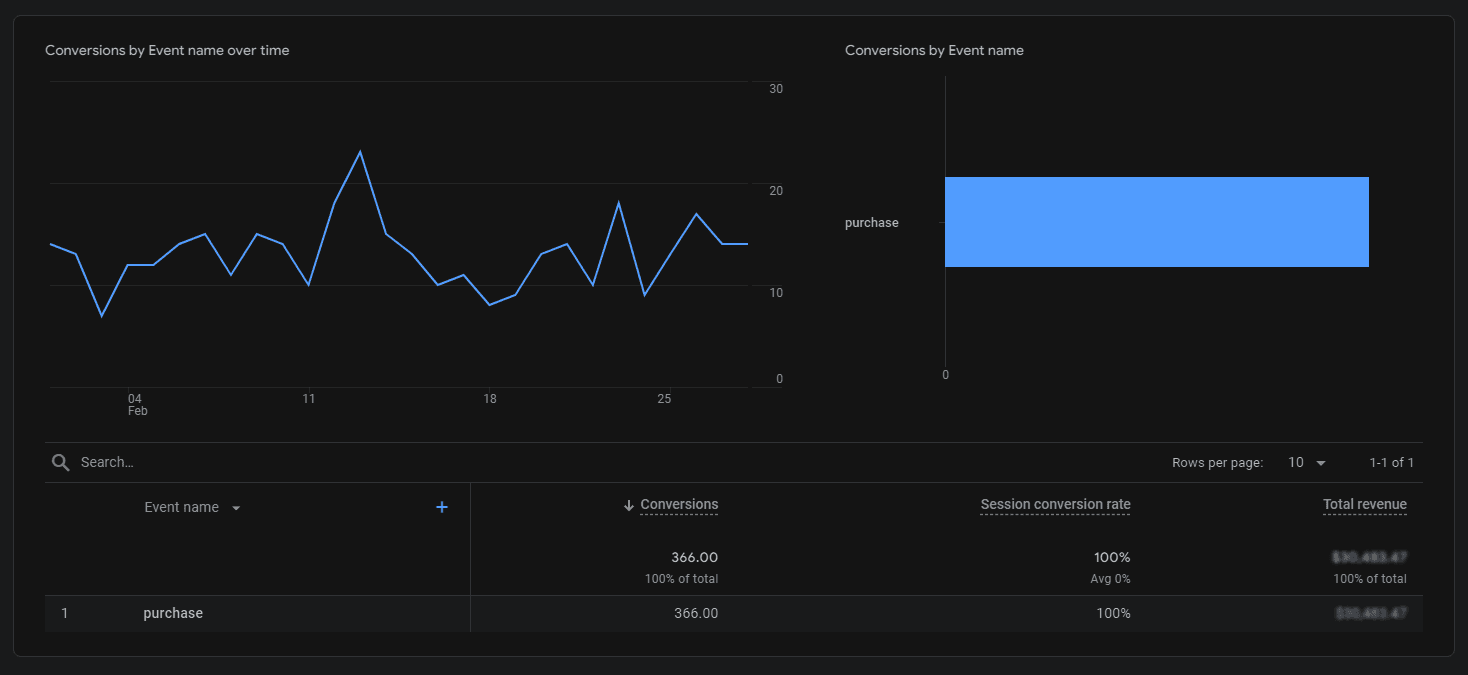
The Conversion Analysis Report in GA4 is essential for evaluating the effectiveness of your website or app in achieving business goals. It tracks user actions valuable to your business, such as purchases, sign-ups, or downloads, offering insights into how well your site converts visitor interactions into desired outcomes.
Creating the Conversion Analysis Report in GA4
- Access Your GA4 Property: Log in to your Google Analytics account and select the GA4 property you wish to analyse.
- Define Conversions: Ensure your desired conversion events are correctly set up in GA4. Go to ‘Settings’ and find 'Events' in the 'Data Display' section and mark relevant events as 'Conversions'.
- Navigate to Reports: In the GA4 interface, click 'Reports' on the left-hand menu.
- Custom Reports: Select 'Library' at the bottom of the menu to access the report builder.
- Create New Report: Choose 'Create New Report' and select 'Create Detailed Report'.
- Setting Up the Report:
- Create a blank report.
- To segment your data, add dimensions like 'Event Name', 'Age', 'Gender', or 'Geography'.
- Include metrics such as 'Conversions', 'Conversion Rate', and 'Total Revenue' (depending on whether it’s an e-commerce site).
- Click save and title the report as 'Conversion Analysis'.
- Customisation: You can further customise the report by adding comparison data ranges, segmentation, or cohort analysis to gain deeper insights.
- Save and Review: Save the report for ongoing analysis. Regularly reviewing this report helps you understand the effectiveness of your conversion strategies and identifies areas for improvement.
Interpreting the Report
The Conversion Analysis Report clearly shows how and where conversions are happening. It helps identify high-performing segments, underperforming areas, and potential opportunities for optimising conversion funnels. Businesses can enhance their strategies to improve overall conversion rates by continually analysing and iterating based on this report.
Report 3: Audience Demographics Report
Understanding the Audience Demographics Report
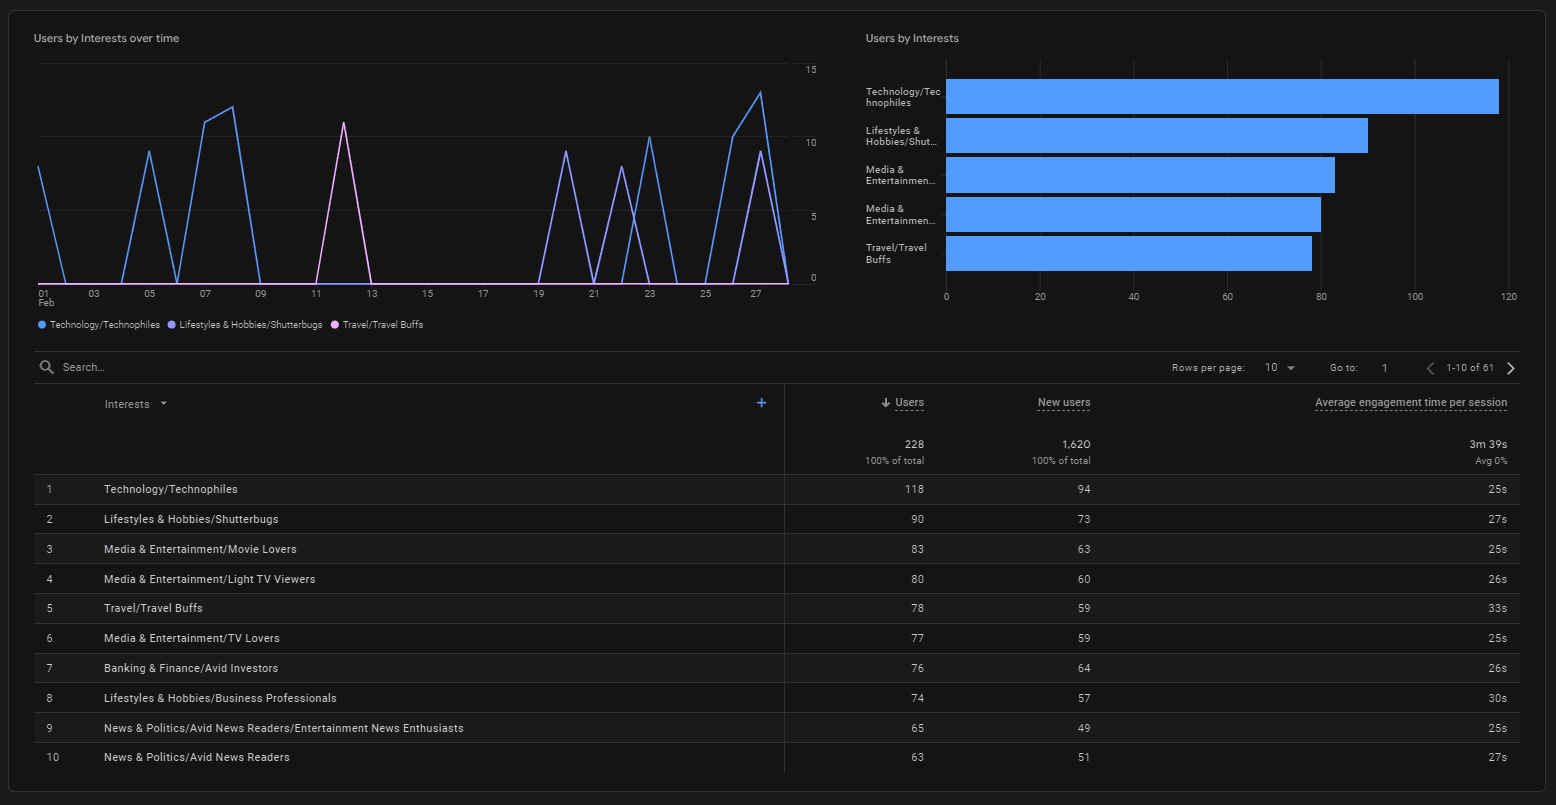
The Audience Demographics Report in GA4 provides vital insights into the characteristics of your website or app users. This report helps you understand your users' age, gender, interests, and other demographic factors. Such insights are crucial for tailoring marketing strategies and content to suit your audience's preferences.
Creating the Audience Demographics Report in GA4
- Access Your GA4 Property: Log in to your Google Analytics account and select the GA4 property you wish to analyse.
- Navigate to Reports: In the GA4 interface, click 'Reports' on the left-hand menu.
- Custom Reports: Select 'Library' at the bottom of the menu to access the report builder.
- Create New Report: Choose 'Create New Report' and select 'Create Detailed Report'.
- Setting Up the Report:
- Create a blank report.
- Under 'Dimensions, ' select options such as 'Age', 'Gender', 'Interests', and 'Geolocation'.
- In 'Metrics', include 'Users', 'New Users', and 'Engagement Time' to gauge the reach and engagement across different demographic segments.
- Click save and title the report ‘Audience Demographics’.
- Customise Your Report: Enhance the report by adding filters or segments to focus on specific user groups or behaviours.
- Save and Utilise: Save the report for continuous monitoring. Regular analysis of this report can inform content creation, advertising strategies, and overall user experience enhancements.
Interpreting the Report
The Audience Demographics Report is invaluable for understanding your user base's composition. It allows businesses to identify key segments that are most engaged or valuable, informing targeted marketing efforts and content customisation. This report can also highlight untapped demographic groups, offering opportunities for expansion and outreach.
Report 4: Traffic Source Analysis Report
Understanding the Traffic Source Analysis Report
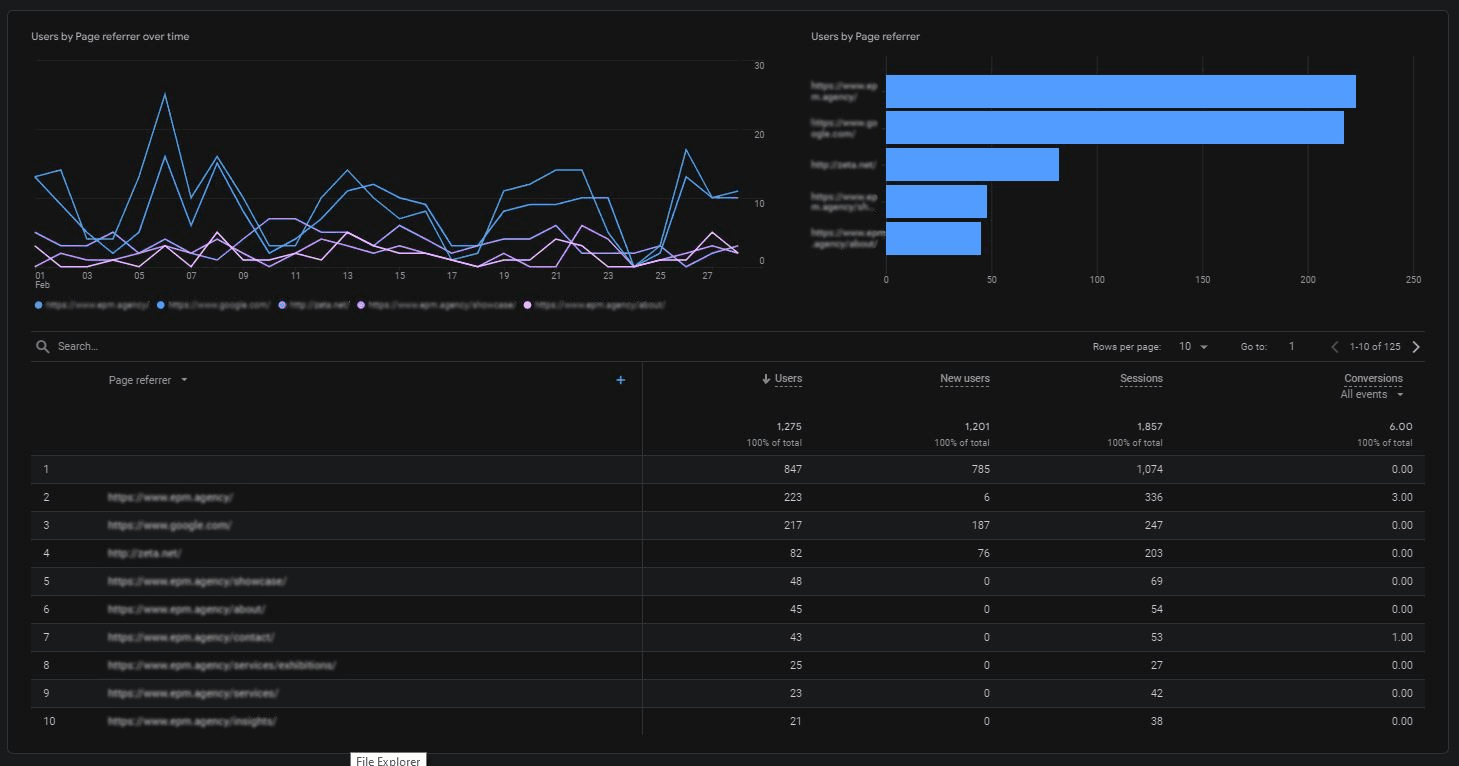
The Traffic Source Analysis Report in GA4 offers insights into your website or app users' origin. This report is crucial for understanding the effectiveness of your marketing channels, be it organic search, social media, referrals, or paid campaigns. It helps identify which sources drive the most traffic and contribute to conversions.
Creating the Traffic Source Analysis Report in GA4
- Access Your GA4 Property: Log in to your Google Analytics account and select the GA4 property you wish to analyse.
- Navigate to Reports: In the GA4 interface, click 'Reports' on the left-hand menu.
- Custom Reports: Select 'Library' at the bottom of the menu to access the report builder.
- Create New Report: Choose 'Create New Report' and select 'Create Detailed Report'.
- Setting Up the Report:
- Create a blank report.
- For 'Dimensions', select 'Session Source/Medium', 'Session Campaign', and 'Page Referrer' to break down the traffic sources.
- Include 'Metrics' such as 'Users', 'New Users', 'Sessions', and 'Conversions' to evaluate the performance of each source.
- Click save and title the report as 'Traffic Source Analysis'.
- Report Customisation: Customise your report by adding advanced segments, filters, or comparison data to gain deeper insights into specific channels or campaigns.
- Save and Analyse: Save your report for ongoing use. Regular analysis helps to understand the effectiveness of different traffic sources and guide marketing strategies.
Interpreting the Report
Analysing the Traffic Source Analysis Report enables you to identify your website or app's most valuable traffic sources. This understanding is key to optimising marketing efforts, allocating budgets effectively, and enhancing strategies to drive more traffic and conversions from the most productive channels.
Report 5: E-commerce Performance Report
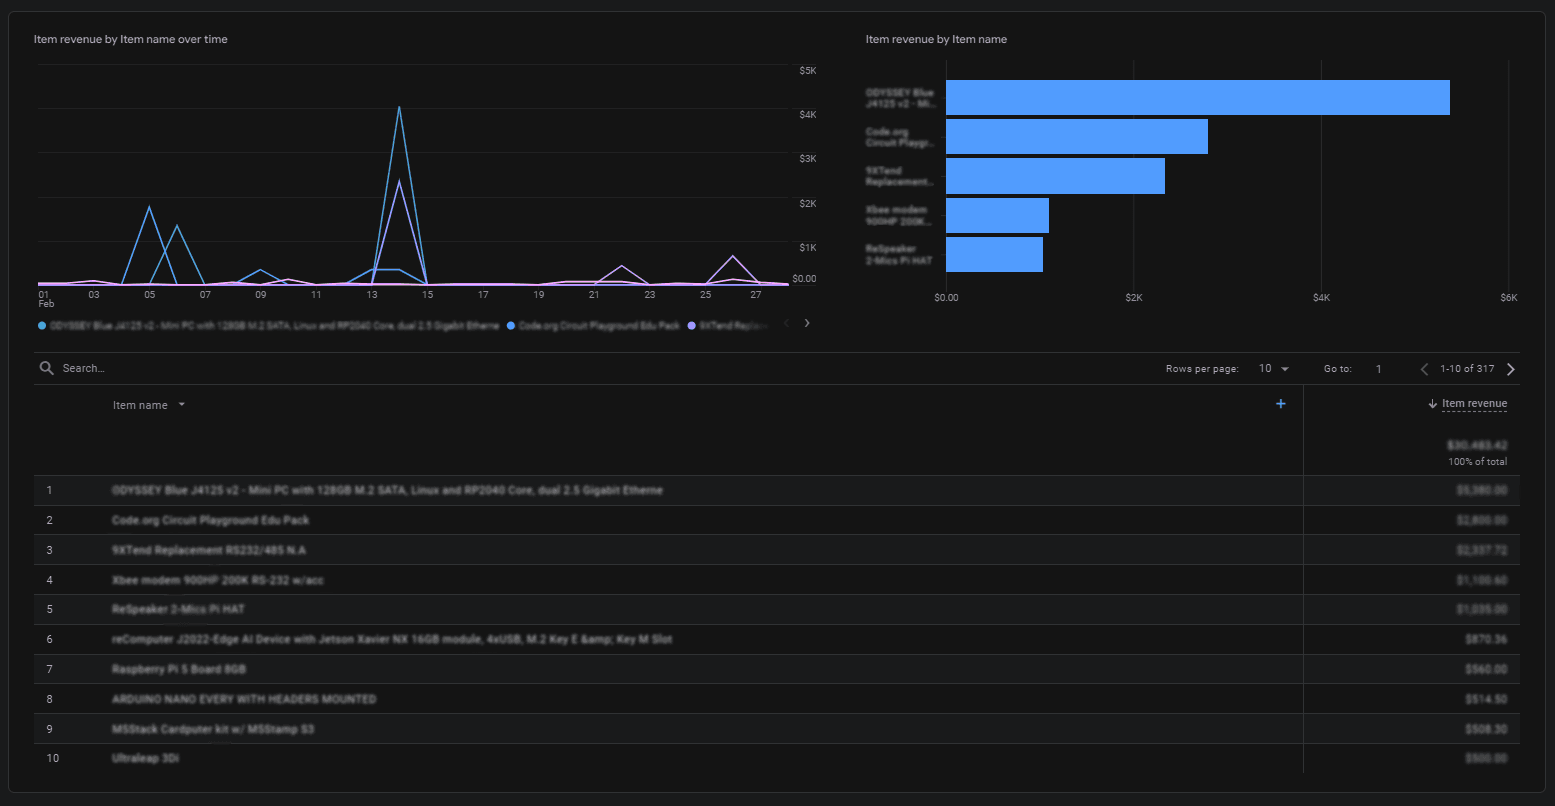
Understanding the E-commerce Performance Report
The E-commerce Performance Report in GA4 is essential for online businesses to track and analyse their sales performance. This report provides detailed insights into online shopping behaviour, transaction details, and revenue generation. It is invaluable for understanding customer purchase patterns, product performance, and overall e-commerce effectiveness.
Creating the E-commerce Performance Report in GA4
- Access Your GA4 Property: Log in to your Google Analytics account and select the GA4 property you wish to analyse.
- Navigate to Reports: In the GA4 interface, click 'Reports' on the left-hand menu.
- Custom Reports: Select 'Library' at the bottom of the menu to access the report builder.
- Create New Report: Choose 'Create New Report' and select 'Create Detailed Report'.
- Setting Up the Report:
- Create a blank report.
- Under 'Dimensions', select relevant e-commerce metrics like 'Item Name' and 'Item Category'.
- In 'Metrics', include 'Average Order Value', 'E-commerce Conversion Rate', 'Item Revenue' and 'Unique Purchases'.
- Click save and title the report as 'E-commerce Performance'.
- Customisation of the Report: To gain more detailed insights, you can tailor the report further by adding filters for specific products, categories, or time frames.
- Save and Utilise the Report: Save the report for routine analysis. Regular review of this report is key to understanding the dynamics of your e-commerce activity and making data-driven decisions to boost sales performance.
Interpreting the Report
The E-commerce Performance Report is crucial for online retailers and businesses. It helps identify top-selling products, understand customer buying behaviour, and evaluate the effectiveness of promotional strategies. Insights from this report can guide inventory management, marketing campaigns, and website optimisation to enhance the overall e-commerce experience and profitability.
Adding Reports to Collections and Displaying Them in Google Analytics
After creating custom reports in Google Analytics 4 (GA4), it's helpful to organise them into collections for easy access and efficient analysis. Here's a guide on how to add reports to collections and display them within GA4:
- Customising and Saving Reports:
- Begin by customising your report in GA4 and choosing the desired dimensions and metrics.
- You can add up to two charts (bar, line, or scatter) for visual representation.
- If you plan to use your report in an overview, consider adding Summary Cards for a snapshot view.
- Once finalised, name and save your report.
- Building an Overview Report:
- Overview Reports in GA4 are constructed from information cards that pull data from your Detail Reports or standard GA4 reports.
- You can add up to 16 cards to an Overview Report.
- Use the "Add Cards" option to select existing cards from your Detail Reports or other standard GA4 reporting cards.
- Customise the dimensions and metrics on these cards to suit your needs.
- By combining various cards, you create an effective dashboard for your custom report collection.
- Using Report Library Templates:
- The Report Library in GA4 offers a range of templates for quickly creating new report collections.
- These templates can be tailored to your specific requirements.
- Linking Reports:
- Some GA4 reports can be linked to Google-defined reports. Linked reports will receive updates from Google.
- You have the option to unlink reports if you prefer full control over the content.
- Publishing Collections:
- To make a collection visible in the reports section, you need to publish it.
- Select the collection you want to publish, then choose the 'Publish' option.
- Future of Reporting in GA4:
- With ongoing development, expect GA4's reporting features to expand and evolve.
Remember, the best way to familiarise yourself with GA4's interface and capabilities is to use and explore its features actively. Customising reports and organising them into collections enhances the efficiency of your data analysis and helps in gaining better insights for your online business.


